
A wireless water pressure monitoring system is useful when the operating team needs pressure evidence from locations that are expensive, unsafe, or impractical to wire. A sound design starts with the decision the measurement must support—such as identifying sustained low pressure, verifying a pump’s operating window, or documenting pressure at a remote asset—not with a transmitter or network choice.
The system should be designed as a measurement chain: process connection, sensor range, installation location, sampling logic, communications path, data platform, alarms, and field verification. A pressure value delivered remotely is not automatically proof of a leak, a pump fault, or adequate pressure at every point in a network. It is evidence that must be interpreted in operating context.
Define the operational decision before selecting hardware
Write a short decision statement for each monitored point. It should identify what action a user will take, how quickly that action is needed, and what pressure behavior counts as abnormal.
For example:
Alert the maintenance team when discharge pressure remains below the normal operating band for 10 minutes while the pump is commanded to run.
This is more actionable than “monitor pressure remotely.” It establishes the required measurement location, sampling interval, alarm persistence, communications expectation, and whether pump run status is needed as a second input.
Common operational decisions include:
- Detecting a sustained pressure loss downstream of a booster pump.
- Confirming that pressure reaches a required operating band during scheduled operation.
- Comparing upstream and downstream pressure to identify excessive restriction across a filter, valve, or line segment.
- Monitoring static pressure at a remote tank outlet, irrigation zone, valve vault, or hydrant connection.
- Providing trend records for maintenance troubleshooting.
- Identifying pressure cycling that may indicate poor control tuning, pump short-cycling, or changing demand.
A single pressure point can identify an abnormal condition, but it usually cannot establish its cause. For example, low pressure may result from a pump problem, a closed valve, a clogged strainer, a depleted source, unexpected demand, a line break, or an instrument installation issue. When the decision requires distinguishing among these possibilities, include supporting data such as pump command and run feedback, tank level, flow, valve position, or a second pressure point.
Define the consequences of missed events and nuisance alarms separately. A system designed to catch a short pressure transient will have different sampling, local alarm, buffering, and power requirements than one designed to document daily pressure trends.
Choose pressure range, sampling rate, and sensor location
Choose the pressure range from the maximum credible operating pressure, not normal pressure alone. Consider pump shutoff conditions, pressure-control failure, thermal expansion in isolated liquid sections, surge or water hammer, and any test pressure that may be applied while the instrument remains installed.
The selected range affects resolution and practical usefulness. A very wide-range sensor may survive high pressure but provide less useful granularity around a low normal operating point. Conversely, a narrowly selected range may be exposed to overpressure during an abnormal event.
Confirm these items in the sensor documentation:
- Pressure range and the units used on the configuration and data platform.
- Maximum permitted overpressure and burst limits, if stated by the manufacturer.
- Pressure reference: gauge, absolute, or sealed gauge.
- Wetted materials and compatibility with the water quality and treatment chemicals.
- Process connection type, thread standard, sealing method, and required adapter.
- Operating temperature range at the actual installation point.
- Specified accuracy statement, including whether it includes nonlinearity, hysteresis, repeatability, and temperature effects.
- Long-term stability or recalibration guidance when provided.
Use the correct pressure reference
Most open-to-atmosphere water systems are monitored with gauge pressure, meaning pressure relative to local atmospheric pressure. Absolute pressure is referenced to a vacuum. The two are not interchangeable without accounting for atmospheric pressure.
For a vented tank, gauge pressure at the liquid surface is approximately zero. For a sealed vessel, absolute or gauge measurement may be appropriate depending on the process question. State the reference explicitly in the tag, configuration record, and historian label—for example, psi g or psi absolute.
Place sensors where pressure answers the question
Pressure changes with elevation in a liquid-filled system. For water near ordinary field conditions, elevation produces approximately 0.433 psi per vertical foot. This is a planning approximation, not a substitute for process calculations where density varies materially.
Illustrative example:
Elevation pressure difference = 0.433 psi/ft × 30 ft = 13.0 psi
If one transmitter is 30 ft below another, it may read about 13 psi higher under static conditions solely because of elevation. A pressure comparison across a site should therefore include instrument elevations.
Useful locations often include:
- Pump suction and discharge, when assessing pump differential pressure or system response.
- Upstream and downstream of a filter, regulator, control valve, or long pipeline segment.
- The hydraulically remote end of a distribution branch, where low-pressure complaints occur.
- A point near a critical user or process connection.
- A tank outlet, pressure zone boundary, or remote valve location.
Avoid locations that create an unrepresentative reading. A small dead-end branch can trap air and dampen or distort pressure response. A point immediately adjacent to a pump discharge may be dominated by pulsation. A partially blocked isolation valve, long small-bore impulse line, or poorly vented enclosure can make a sound sensor appear unreliable.
Install the pressure port so it can be isolated, inspected, and replaced without unnecessary process disruption where the piping design permits. Protect it from freezing, physical impact, flooding, and unauthorized adjustment.
Match sampling rate to the event duration
Sampling rate is how often the instrument measures pressure. It determines what changes can be observed. If pressure is sampled only once every 15 minutes, an event lasting 2 minutes may be entirely missed.
An illustrative planning method is:
Samples during event = event duration / sampling interval
For a 10-minute low-pressure condition sampled every 1 minute:
10 min / 1 min = 10 samples
That creates multiple observations for a persistence alarm. For a 30-second event sampled every 5 minutes:
0.5 min / 5 min = 0.1 samples
The event is unlikely to be represented reliably.
This calculation does not guarantee detection. The timing of the event relative to the sampling schedule matters. If short-duration events are important, specify a faster measurement interval, event-triggered local capture, or a dedicated high-speed pressure logging approach. Do not assume a battery-powered wireless transmitter designed for slow trend monitoring will characterize water hammer.
Compare cellular, NB-IoT, LoRa, and LoRaWAN
Radio selection is a site architecture decision. It depends on coverage, ownership of infrastructure, data volume, antenna placement, power availability, cybersecurity requirements, and who will maintain the network.
LoRa is a radio modulation technology. LoRaWAN is a network protocol and architecture commonly used with LoRa radio devices, gateways, and a network server, as detailed in the LoRa Alliance technical specifications. A device described as “LoRa” is not necessarily interoperable with every LoRaWAN network; confirm protocol compatibility and regional radio configuration.
| Option | Typical fit | Infrastructure dependency | Key planning limitation |
|---|---|---|---|
| Cellular LTE/4G | Distributed sites with usable carrier service and moderate data needs | Carrier service, subscription, SIM or eSIM arrangement, and cloud path | Indoor, underground, and remote coverage must be tested at the installed antenna position |
| NB-IoT | Low-data stationary instruments where an operator supports the service | Compatible carrier coverage, device support, subscription, and platform integration | Availability and roaming behavior vary by carrier, geography, and deployment |
| LoRa | Private point-to-point or proprietary low-power radio arrangements | Depends on the specific radio system | “LoRa” alone does not define network management, security model, or backend integration |
| LoRaWAN | Campus, utility, industrial site, or regional deployments with suitable gateway coverage | Gateways, network server or managed network, device onboarding, and backhaul | Coverage depends heavily on antenna height, obstructions, gateway placement, and network capacity |
Cellular systems can simplify deployment where the asset is geographically dispersed and carrier coverage is proven. They also create recurring service and account-management work. Confirm whether the device supports the intended carrier bands and whether its service plan allows the expected reporting behavior.
NB-IoT is designed for low-data connected devices, but it is not a universal substitute for conventional cellular. Verify actual service at the site, device-network compatibility, onboarding process, and how the network behaves during poor coverage or prolonged inactivity.
LoRaWAN can be effective when many instruments are concentrated within a site or service territory and gateway infrastructure is justified. It generally requires more deliberate network ownership or managed-network coordination than a single cellular endpoint.
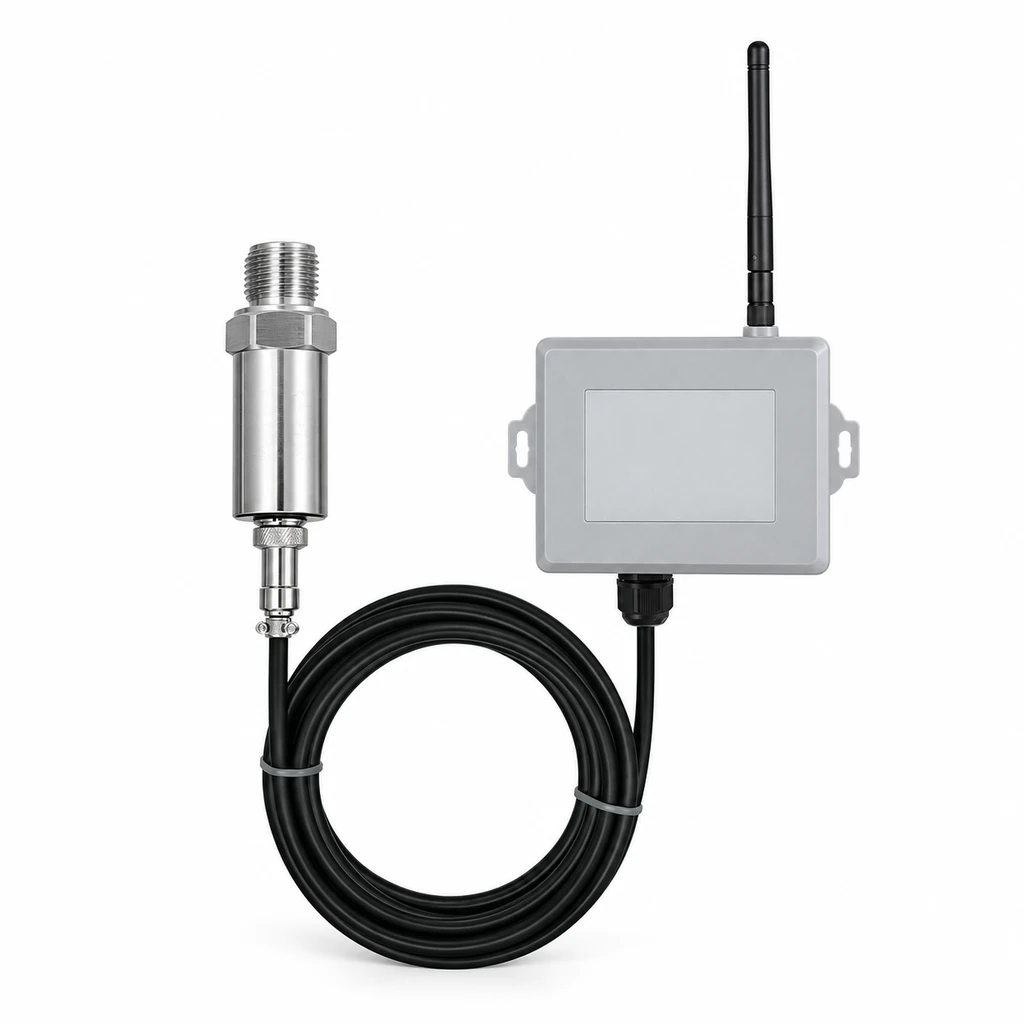
For water-network applications, a purpose-built wireless pressure transmitter for water networks may be relevant to evaluate, but the selection should still be based on the documented pressure range, network compatibility, installation conditions, and power plan.
Separate sampling, reporting, and alarm intervals
Sampling, reporting, and alarm intervals are different settings. Treating them as one setting is a common design error.
- Sampling interval: How often the device measures pressure.
- Reporting interval: How often it sends routine data.
- Alarm interval: How quickly it sends an exception after a local alarm condition is met.
- Data upload interval: How often stored records are transferred after an outage, depending on system design.
A practical architecture may sample every minute, report a rolling value every 15 minutes, and transmit an alarm promptly when pressure stays outside the permitted band for a defined duration. Whether a particular instrument can perform this logic locally must be confirmed from its documentation.
Alarm logic should use more than a single threshold whenever possible:
- High and low thresholds define the normal operating band.
- Hysteresis prevents repeated alarm state changes near a threshold.
- Persistence time requires an abnormal value to continue before declaring an alarm.
- Rate-of-change logic identifies unusually rapid pressure movement.
- Operating-state gating evaluates pressure only when related equipment should be active.
Illustrative hysteresis logic:
- Enter low-pressure alarm below 40 psi.
- Clear low-pressure alarm only after pressure rises above 43 psi.
- Require pressure below 40 psi for 5 consecutive minutes before alarming.
The 3 psi separation is hysteresis. It reduces chatter if readings fluctuate near 40 psi. These values are examples only; establish limits from normal operating data, process requirements, instrument uncertainty, and the consequence of action.
A low-pressure alert should not be labeled “leak detected” unless the system has evidence sufficient for that conclusion. Pressure decline may support leak investigation, particularly when combined with flow, valve state, and demand information, but it does not identify every leak or rule out other causes.
Plan coverage, antenna, enclosure, and power
Verify radio performance where the antenna will actually be installed—not in an open parking area, at ground level beside the enclosure, or using a temporary phone test as a substitute. Vaults, pits, below-grade equipment rooms, metal panels, reinforced concrete, water, and nearby structures can substantially degrade radio propagation.
Document a site survey that includes:
- Intended mounting location and antenna elevation.
- Signal or link-quality observations relevant to the selected network.
- Antenna cable routing, connector type, cable length, and weather protection.
- Nearby metalwork, electrical cabinets, and obstructions.
- Flooding, condensation, solar exposure, vibration, and physical-access risks.
- Grounding and surge-protection approach where appropriate to the installation.
An external antenna can improve placement flexibility, but cable losses, water ingress at connectors, and incorrect antenna selection can offset the benefit. Confirm the antenna is suitable for the radio bands in use and the installed environment.
Size battery life from the real duty cycle
Battery life cannot be inferred from a product category or a nominal “low-power” label. It depends on measurement current, radio connection and retry behavior, signal strength, temperature, reporting frequency, alarm traffic, local logging, and battery characteristics.
An illustrative average-current estimate is:
Average current = sum of (current in each state × fraction of time in that state)
Then:
Estimated operating hours = usable battery capacity in mAh / average current in mA
Suppose a design assumes 15,000 mAh usable capacity and calculates 0.25 mA average current:
15,000 mAh / 0.25 mA = 60,000 hours
60,000 hours / 8,760 hours per year = 6.85 years
This is only a mathematical estimate. It excludes uncertainty from cold conditions, battery aging, self-discharge, high transmit retries, and any reserve margin. A field power plan should use the manufacturer’s documented battery information and a conservative communications scenario, especially at marginal-signal sites.
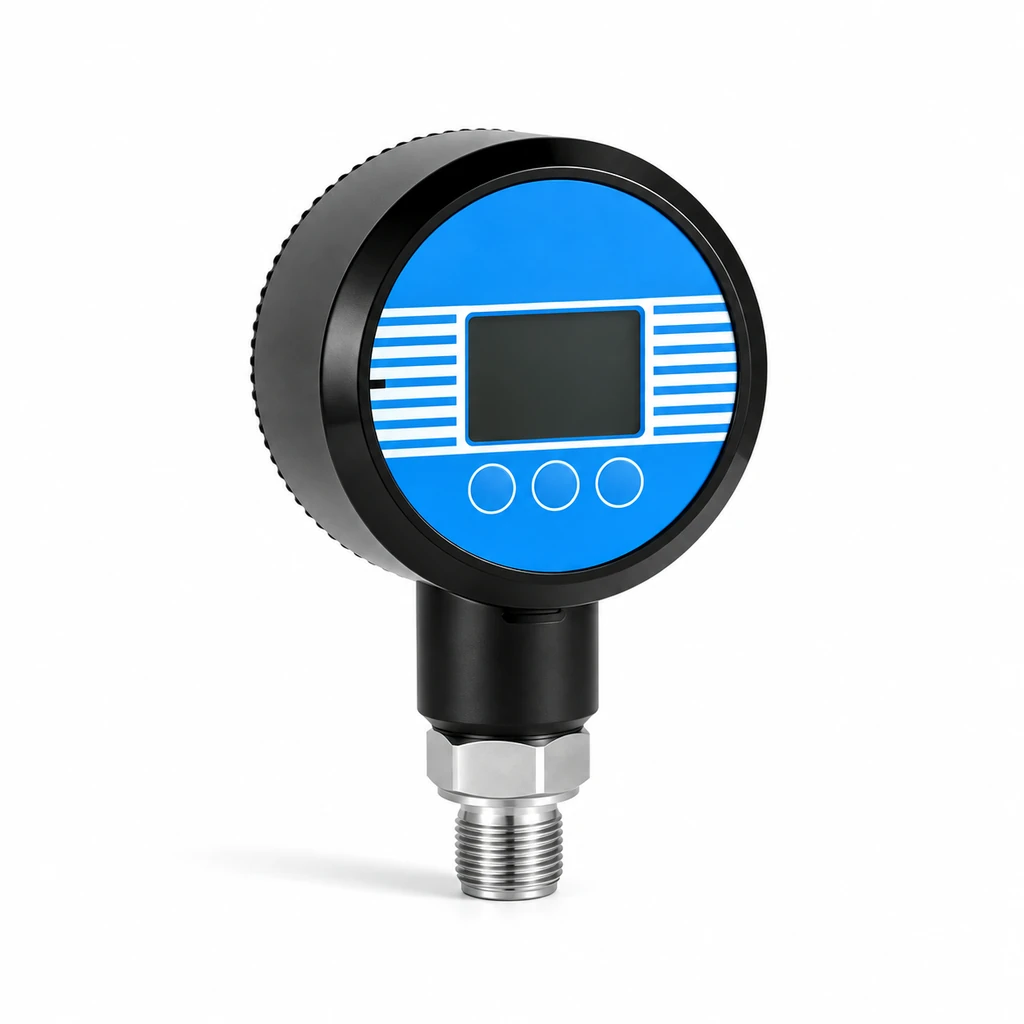
Where a site has reliable power, externally powered instruments may reduce battery replacement work but introduce requirements for supply quality, wiring protection, grounding, and outage behavior. A 4G/NB remote digital pressure gauge is one type of equipment to compare when a cellular-based remote display or reporting approach is under consideration; confirm the exact power, network, and environmental configuration before specification.
Design data-quality alarms and offline buffering
A remote dashboard can show a plausible number even when the measurement chain is impaired. Add data-quality checks that distinguish a process problem from a communications or instrument problem.
At minimum, define alarms or status indicators for:
- No report received within the expected communication window.
- Low battery or power condition, where available.
- Sensor fault or out-of-range status, where available.
- Repeated identical values over an implausibly long period.
- Implausibly fast pressure changes for the application.
- Measurements outside the physical limits of the installation.
- Clock or timestamp problems after reconnection.
- Communication retry or poor-signal indicators, if exposed by the system.
Offline buffering is local storage of time-stamped readings during a communications interruption. It can preserve trend data, but it does not create real-time visibility during the outage. Confirm:
- How many records can be retained under the chosen sample interval.
- What happens when memory is full.
- Whether alarms are retained, retried, or only logged.
- Whether backfilled data retain original timestamps.
- How duplicate records and out-of-order uploads are handled by the platform.
- Whether configuration changes are recorded with an effective date and time.
Use a clear tag convention and retain configuration history. A trend becomes difficult to defend if users cannot determine when range, units, sample interval, alarm limits, location, or scaling changed.
Commission against a trusted local reference
Commissioning should verify the installed system, not only confirm that a transmitter powers up. Compare the installed reading against a trusted local reference at stable pressure conditions.
A trusted reference is a gauge, calibrator, or other measurement device with suitable accuracy for the required decision and a known calibration condition. It should be connected so both instruments see the same process pressure as closely as practical. Differences in elevation, trapped air, pulsation, temperature, and restrictions in fittings can create apparent disagreement.
A basic field comparison process is:
- Verify tag number, pressure reference, range, engineering units, and installation point.
- Inspect the process connection, valve position, leaks, impulse path, and venting as applicable.
- Stabilize the process at one or more representative pressure points.
- Record the local reference value, wireless value, timestamp, and relevant operating state.
- Calculate the observed difference:
Difference = wireless reading − reference reading - Compare the difference with the combined uncertainty and acceptance criteria defined for the application.
- Confirm that the remote platform displays the correct value, units, timestamp, alarm state, and asset identity.
- Create a controlled alarm condition where it can be done safely, then verify notification, escalation, and recovery behavior.
Sensor accuracy is not the same as total installed measurement uncertainty. The installed result can include transmitter error, reference error, temperature effect, mounting elevation, process instability, and resolution or scaling effects.
When individual errors are independent and expressed as comparable uncertainty quantities, a simplified root-sum-square estimate may be used:
Combined uncertainty = sqrt(U_sensor² + U_reference² + U_installation²)
For example, using illustrative values of 0.5 psi for the sensor contribution, 0.2 psi for the reference contribution, and 0.3 psi for installation effects:
Combined uncertainty = sqrt(0.5² + 0.2² + 0.3²) = 0.62 psi
This calculation is not valid for every case. Systematic effects—such as an uncorrected 10-ft elevation difference—should be corrected or treated separately rather than assumed to cancel statistically.
When inspection or calibration documentation is required, contact our team to confirm the available records, test points and acceptance criteria for the selected instrument. Keep those records with the agreed configuration. Site commissioning must still verify antenna performance, plumbing, elevation, platform mapping and alarm routing under the actual installation conditions.
For a dedicated hydrant installation, confirm the process connection, physical protection, access method, pressure limits and data requirements with our team. A general wireless pressure transmitter should not be assumed to meet the installation requirements solely because it can report pressure remotely.
Use a lifecycle and maintenance checklist
A wireless system remains useful only if its configuration, power source, radio path, and measurement condition are maintained over time. Assign ownership for each task before installation.
Specification and field-work checklist
- State the operational decision, required response time, and action owner.
- Define normal pressure band, alarm thresholds, hysteresis, persistence, and escalation path.
- Identify all supporting signals needed to interpret pressure correctly.
- Select gauge, absolute, or sealed-gauge reference deliberately.
- Specify pressure range using credible maximum conditions, not normal pressure alone.
- Confirm wetted materials, connection, sealing method, temperature exposure, and mounting constraints.
- Document sensor elevation and account for static head when comparing locations.
- Set sampling, routine reporting, alarm reporting, and backfill behavior separately.
- Verify network coverage at the installed antenna location and document the test conditions.
- Confirm radio protocol, carrier or gateway dependencies, onboarding, and recurring service responsibilities.
- Calculate power demand from the configured duty cycle and include a conservative maintenance margin.
- Define offline storage capacity, overdue-data alarms, timestamp handling, and data ownership.
- Compare the installed reading with a suitable local reference and retain the record.
- Test alarm delivery, acknowledgement, restoration, and communication-loss behavior.
- Establish inspection, battery replacement, reference comparison, and configuration-review intervals.
- Keep an asset record with tag, serial number, location, range, units, installation date, configuration revision, and maintenance history.
For a battery-operated measurement point, compare the HPT-20P wireless pressure transmitter against the required pressure span, process connection, reporting interval and radio coverage. If the project uses LoRaWAN, the GW-100 LoRaWAN gateway provides a gateway option to assess separately. Confirm matching regional bands, device onboarding, network-server compatibility and backhaul requirements before selecting the complete system.
Technical sources and further reading
- LoRa Alliance technical specifications for LoRaWAN protocol and network-design context.
- NISTIR 8259A for foundational cybersecurity capabilities in IoT devices.
Technical references are linked in the article. Confirm product-specific requirements against the selected configuration.